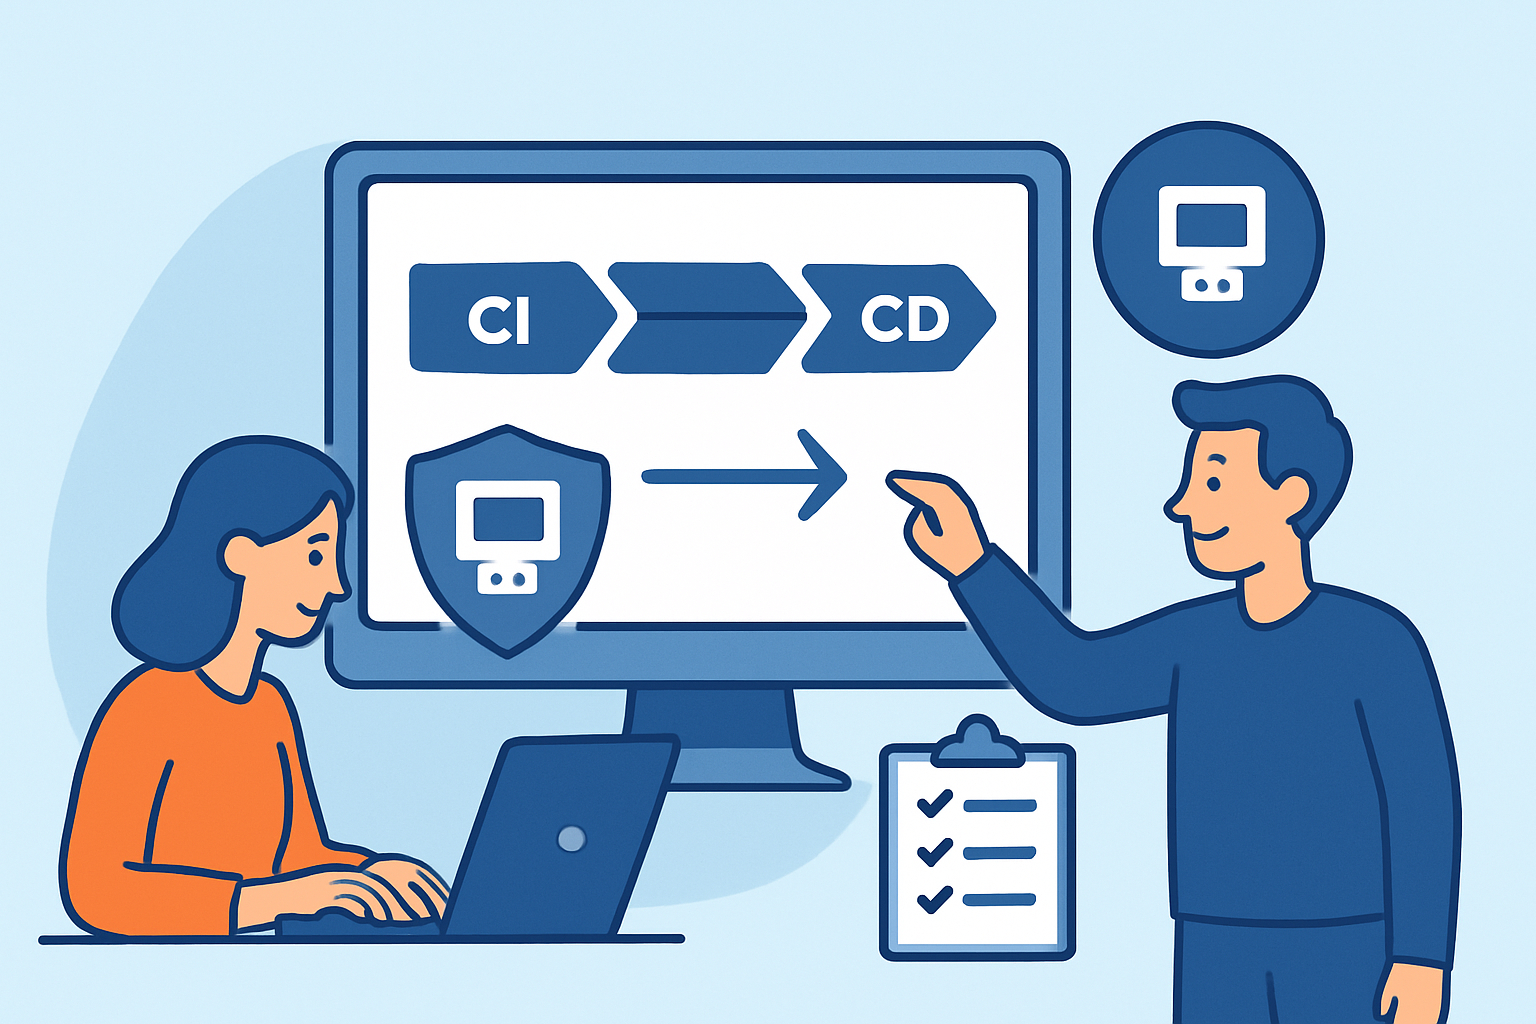
Integrating port monitoring into your CI/CD pipeline means every deployment automatically checks for unexpected open ports before code reaches production – catching misconfigurations at the source rather than days or weeks later. Teams that ship frequently without this kind of gate are essentially flying blind: every release is a potential opportunity for a new service to bind to an unintended port, or for a misconfigured container to expose something that was never meant to be public.
Why Deployment Pipelines Create Port Security Blind Spots
Deployment pipelines are optimized for speed. Tests run, containers build, infrastructure provisions, and code ships – often in under ten minutes. Port security checks rarely fit into that flow because they’ve historically been a manual, point-in-time activity.
The result is a gap. A developer adds a debug service during testing and forgets to remove it. A Helm chart update changes a service type from ClusterIP to NodePort. A misconfigured environment variable exposes an admin panel. None of these trigger test failures. None of them show up in code review. But all of them expand your attack surface in production.
What Port Monitoring in a Pipeline Actually Looks Like
The core idea is straightforward: after a deployment completes – or during a staging gate – an external port scan runs against the deployed environment. The results are compared against a known-good baseline. Any deviation, a new port open or an unexpected service version, blocks promotion to the next environment or triggers an alert.
This is different from internal checks like netstat or ss. An external scan sees what an attacker would see: which ports are actually reachable from outside the network perimeter. Internal tooling doesn’t account for firewall misconfigurations or cloud security group changes. External port scans consistently surface findings that internal checks miss, which is exactly why they belong in the pipeline.
Choosing Where in the Pipeline to Place Scans
Not every stage is equally useful for port scanning. Here’s how to think about placement:
Post-deploy to staging – This is the most valuable gate. Scan the staging environment after every deployment. Compare results against a baseline. Block promotion to production if anything unexpected appears.
Pre-production gate – For teams with separate pre-prod environments, run a final scan before the production deploy approval step. This catches anything that slipped through staging.
Post-production verification – Run a scan after production deployments complete. Don’t gate on this – it would delay rollbacks – but use it to confirm the expected state and trigger alerts if something is wrong.
Scheduled overnight scans – Separate from deployment scans, a full-surface scan catches drift that accumulates between deployments: manually opened ports, OS updates that start new services, cloud console changes made outside the pipeline.
Step-by-Step: Adding Port Checks to a CI/CD Stage
This pattern works across most pipeline tools – GitHub Actions, GitLab CI, Jenkins, CircleCI:
Step 1 – Define your port baseline. Document which ports should be open on each environment type. For a typical web application: 443 (HTTPS), maybe 80 redirecting to 443. Everything else should be filtered or closed from an external perspective. Store this baseline as a versioned file in your repository.
Step 2 – Trigger a scan via API after deployment. After your deploy step, call the port monitoring API to initiate a scan against the environment’s public IP or hostname. Capture the scan ID for polling.
Step 3 – Poll for results. External scans typically complete within 60–180 seconds for a targeted host. Poll the results endpoint until the scan finishes or a timeout – five minutes is a reasonable ceiling – is reached.
Step 4 – Compare against baseline. Parse the scan results. For each open port found, check it against your approved baseline list. If any port is open that isn’t on the baseline, fail the pipeline step with a clear message: which port, which service was detected, and what version.
Step 5 – Alert and block on deviation. Fail the pipeline stage. Send a notification to the team’s security channel. The deployment should not proceed to production until the deviation is investigated and either resolved or explicitly approved as a baseline update.
Validating firewall rules with external port scans at staging gates is one of the most reliable ways to catch cloud security group misconfigurations before they reach production.
Handling Baseline Updates Without Creating a Bottleneck
One practical challenge is keeping the baseline current without making updates a bottleneck. A useful pattern: treat baseline changes like code changes. If a new port needs to be approved – say, you’re adding a metrics endpoint on port 9090 – submit a pull request that updates the baseline file. Require a security team review on that PR type using CODEOWNERS or equivalent.
This creates an audit trail. You can see exactly when a port was added to the approved list, who approved it, and which deployment first required it. That’s the kind of evidence that matters during incident investigations and compliance audits.
The Myth That Clean Infrastructure-as-Code Means Safe Ports
A common assumption is that if your IaC is clean – no unexpected ports in your Terraform, no surprise services in your Kubernetes manifests – then external scanning is redundant. This misses several real failure modes.
Cloud provider security groups can be modified manually through the console, bypassing IaC entirely. Load balancer misconfigurations can expose backend ports that the application-level config intentionally keeps internal. Container runtime settings can override expected port bindings. All of these show up in an external scan. None of them show up in IaC linting or static analysis.
Practical Numbers to Set Expectations
Teams implementing pipeline-integrated port monitoring typically detect unexpected open ports within minutes of a bad deployment, compared to days or weeks when relying on periodic manual audits. A scan of a single host takes 60–120 seconds for common ports (top 1000) and 5–10 minutes for a full 65,535-port sweep.
For CI/CD gates, scanning the top 1000 ports covers 99% of the services that would accidentally be exposed. Reserve full-range scans for scheduled overnight jobs where latency doesn’t matter.
Frequently Asked Questions
Won’t adding port scans slow down my deployment pipeline?
A targeted scan of the top 1000 ports on a single host typically completes in under two minutes. For most pipelines, this is an acceptable tradeoff given the security value. If latency is a concern, run the scan in parallel with other post-deploy verification steps – smoke tests, health checks – rather than sequentially after them.
What if staging and production use different IP addresses?
Each environment should have its own baseline. Staging and production will have different IPs but should have identical port profiles – if they don’t, that difference is itself worth investigating. Pass the target IP or hostname as a pipeline variable during the deploy stage, and map it to the correct baseline file for that environment type.
How do we handle ephemeral environments like review apps?
For short-lived environments, skip the baseline comparison and instead alert on any port that isn’t in a global approved list. Setting up alerts for new open ports works well here – scan results for ephemeral environments feed into a security dashboard for async review rather than blocking developer workflows.
Summary
Port monitoring belongs in your CI/CD pipeline the same way secrets detection and dependency scanning do – as a systematic gate, not an afterthought. The mechanics aren’t complex: scan after deploy, compare to baseline, block on deviation, audit baseline changes through code review. The real work is in the setup: defining accurate baselines per environment, choosing the right pipeline stages, and building a lightweight approval workflow for legitimate changes. Once that’s in place, unexpected open ports become a deployment failure rather than a security incident discovered weeks after the fact.