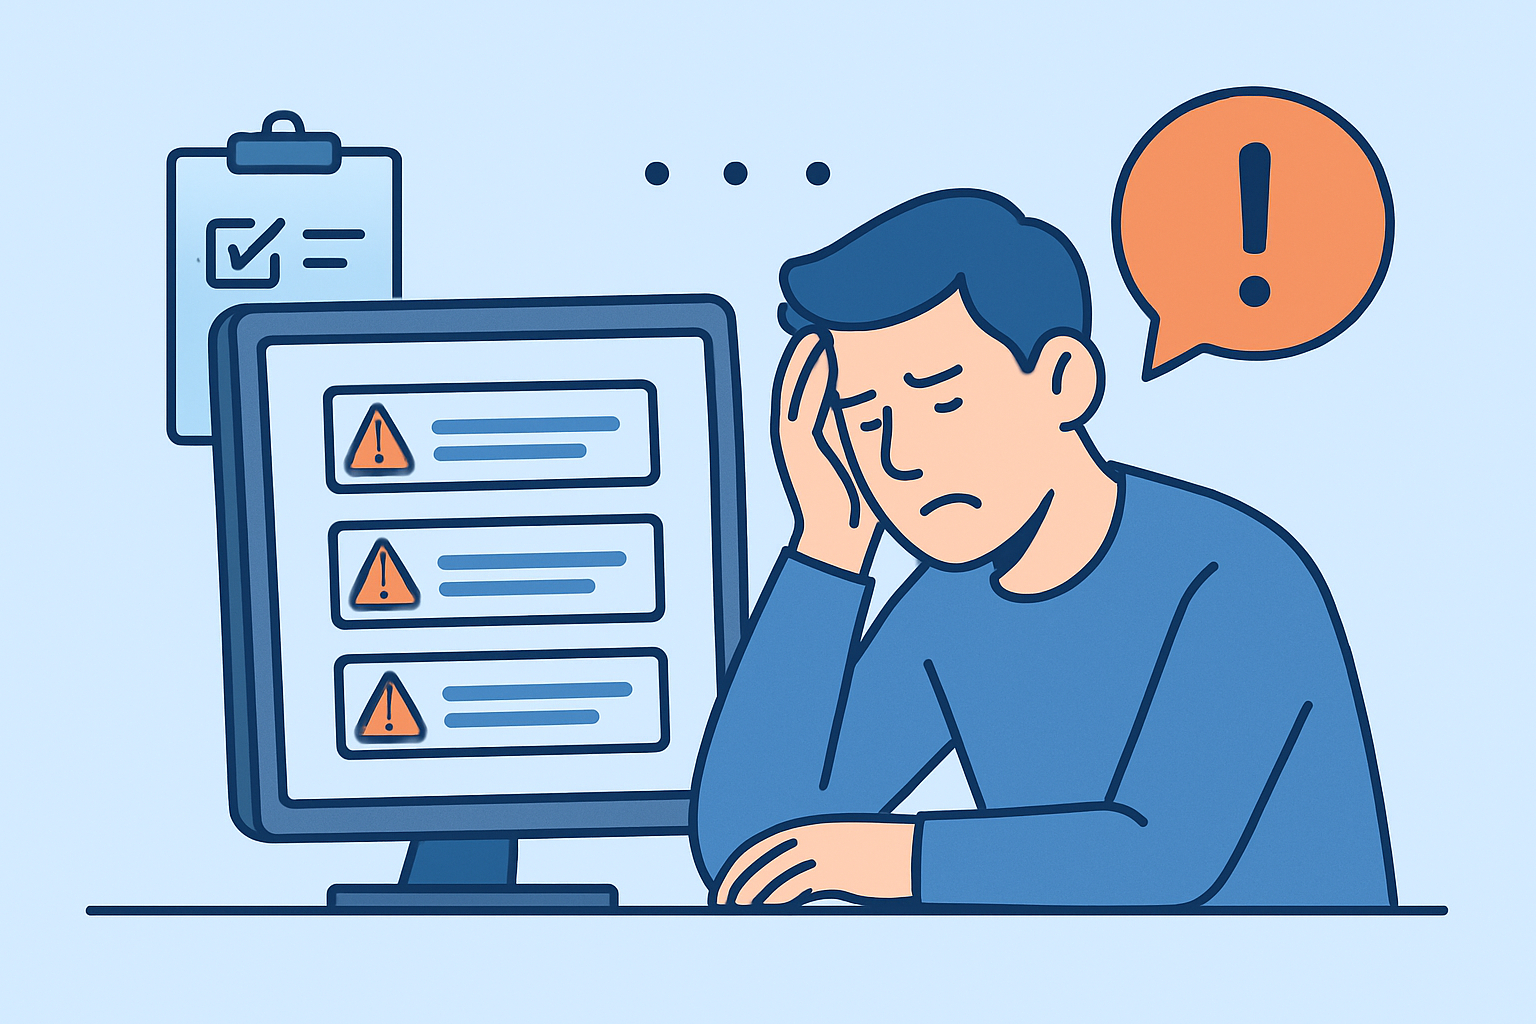
Fifteen new critical findings hit the Slack channel overnight, and the on-call engineer clears all of them without reading past the port number. That’s alert fatigue in a continuous port monitoring program, and it’s the single fastest way to turn a good security control into background noise.
Continuous external scanning – checking a server’s public IP on a regular cadence rather than once a quarter – is supposed to catch problems fast: a new port opened by a misconfigured deploy script, a management interface accidentally exposed, a service upgrade that changed its banner and tripped a version check. The tradeoff is volume. Scan daily or hourly across a fleet of 200 servers and you generate a lot of events, and most of them aren’t incidents. They’re a load balancer health check port flapping, a CDN edge node cycling through IP ranges, or a staging box that always looks a little wrong. When 90% of alerts turn out to be noise, engineers stop reading them carefully, and the 10% that matter get buried.
Why continuous port monitoring produces so much noise
Three things drive the volume. First, scan frequency itself – a program running every 4 hours produces 6x the raw events of one running daily, even if nothing has actually changed on the network. Second, environments that change legitimately and often: autoscaling groups, container orchestration, CI/CD pipelines that spin up ephemeral test servers. Third, poorly tuned severity thresholds that flag every open port as “critical” regardless of whether it’s a known, documented, internet-facing web server on 443 or an unexpected listener on port 8081 nobody can explain.
A team running Kubernetes with frequent pod rescheduling will see NodePort ranges (30000-32767) shift constantly as services get rescheduled across nodes. Without exclusion rules for expected ephemeral ranges, every rescheduling event can look like a new open port to a naive scanner. That’s not a security event. It’s Tuesday.
What alert fatigue actually costs
The cost isn’t abstract. In the aftermath of the 2017 Equinox – actually the more instructive case is the 2013 Target breach, where FireEye’s monitoring system did flag the malware, but the alert was one of many and got dismissed as noise by a security team already drowning in daily volume. That’s the pattern: the signal existed, but it arrived indistinguishable from hundreds of low-value alerts around it.
In port monitoring specifically, the failure mode looks like this: a critical alert for an exposed Redis instance on port 6379 with no authentication arrives at 2 a.m. on a Friday. The on-call engineer, trained by three months of false positives from the same noisy staging cluster, snoozes it along with a batch of others. By Monday, the instance has been enumerated and wiped by an automated ransomware script – this is exactly the pattern documented in mass Redis and MongoDB ransom campaigns since 2017, where unauthenticated instances get found and wiped within hours of exposure, not days.
Building severity tiers that match actual risk
A seasoned security lead doesn’t treat every open port as equally urgent. Effective tiering usually looks like three or four levels:
Critical – internet-facing databases without authentication, RDP or VNC exposed with no VPN gate, or a service matching a CVE with a public exploit and a CVSS score above 9.0.
High – newly opened ports on production servers that weren’t in the last approved baseline.
Medium – version changes on already-known services, or ports opening on non-production hosts.
Informational – expected fluctuation within a documented ephemeral range.
Mapping alerts to something like this, informed by an actual risk scoring model rather than a flat “port is open = alert” rule, cuts volume dramatically without hiding what matters. A team that did this on a mid-size e-commerce environment (roughly 40 production hosts) went from around 180 alerts a week to under 20, with the same or better detection rate on things that mattered, because the classification logic absorbed the noise instead of a human doing it inbox by inbox.
Baselines are the real fix, not better dashboards
Most fatigue traces back to one root cause: no baseline. If the monitoring system doesn’t know what “normal” looks like for a given host, it treats every scan result as new information worth surfacing. Establishing a documented baseline – which ports are expected open, which services should be running, what versions are current – turns the system from “alert on everything” into “alert on deviation.”
This is why building baselines per server matters more than tuning notification channels. A host with a written baseline generates alerts only when reality diverges from the plan: a port opens that isn’t on the list, a service downgrades to a vulnerable version, or a host that should have no internet-facing ports suddenly does. That’s a fundamentally smaller, higher-signal set of events than “here is everything currently open.”
Baselines need owners too. An alert that lands with no clear owner gets triaged by whoever’s on call that week, who may not know if port 5000 on that specific host is a documented internal API or an accidental Flask debug server left running. Tying every listening service to a documented owner means the alert can route directly to someone who can answer in minutes instead of escalating through three people first.
Common mistakes teams make trying to fix this
The most common overcorrection is muting entire categories of alerts after a bad week rather than tuning the specific rule that’s noisy. A team that gets burned by staging-environment noise sometimes disables all alerts for non-production hosts – which works until an attacker pivots through an unmonitored staging box that has database credentials cached from a shared secrets manager.
Another frequent mistake: measuring success by alert volume reduction alone, without tracking whether true positives are still getting caught. Volume dropping from 200/week to 20/week feels like progress, but if it happened because someone raised every threshold uniformly rather than adding baseline logic, real exposures can slip through unflagged. The metric that actually matters is time-to-acknowledgment on critical-tier alerts, not raw count.
A third: treating a one-time scan as good enough after the initial rollout. Attack surfaces drift constantly – new hires, forgotten test deployments, vendor integrations – so the alerting rules that made sense during onboarding need revisiting every quarter, not left static for a year.
Common questions about alert fatigue in port monitoring
How many false positives is “too many” before fatigue sets in?
There’s no universal number, but most SOC research (including SANS survey data from recent years) points to roughly 50% false-positive rate as the threshold where analysts start disengaging from alerts regardless of severity label. If your critical-tier alerts are wrong more than half the time, the tier itself has lost meaning.
Should alert frequency match scan frequency?
No. Scan frequency and alert frequency should be decoupled. Scan often for fast detection, but only alert on state changes against baseline – not on every scan result, even a clean one.
Is reducing alerts always the right goal?
Not by itself. The goal is improving signal-to-noise ratio, which sometimes means reducing volume and sometimes means increasing specificity on alerts that were previously too vague to act on quickly.
Alert fatigue doesn’t mean the monitoring program is failing – it usually means the classification layer between “scan finds something” and “human sees something” hasn’t been built yet. Get baselines, ownership, and severity tiers in place before adding more scan frequency or more dashboards, because more data through a broken filter just produces fatigue faster.